Rosa Lang · 3 September 2026
Polish University Studies Reveal How Analytics Dashboards Are Reshaping Progress Tracking in Remote Classrooms Across Rural Regions
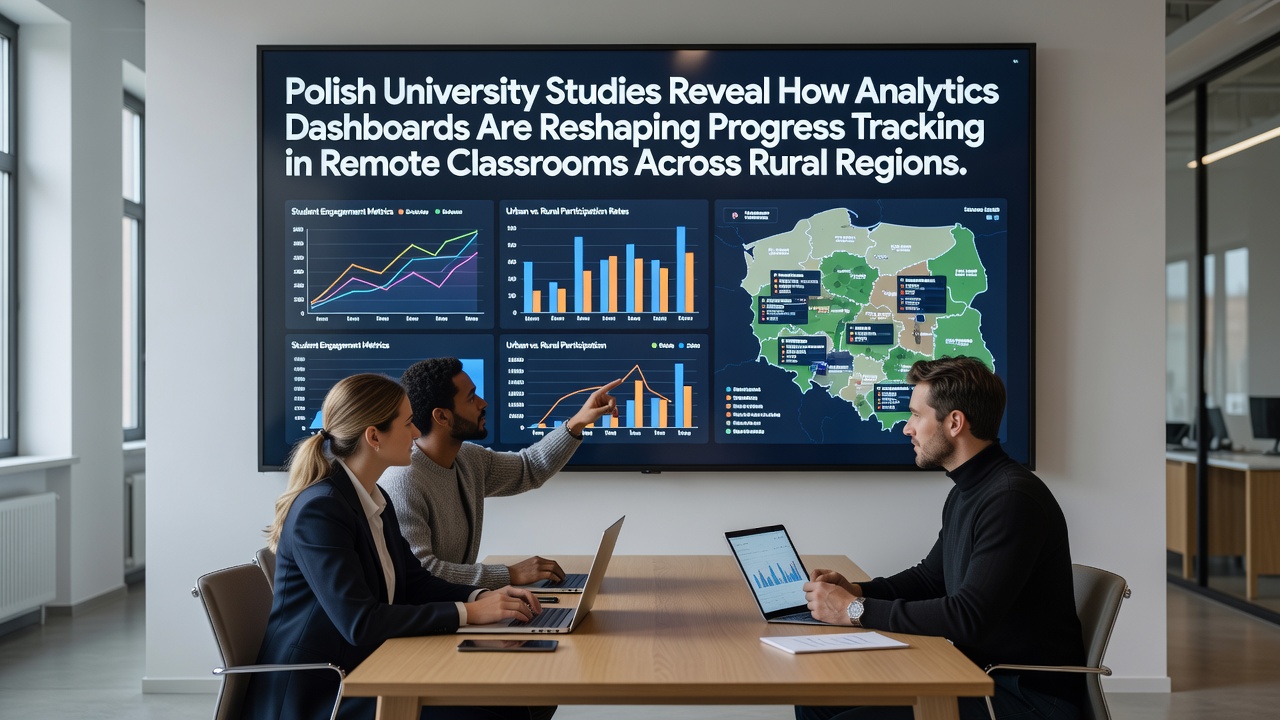
Polish universities have conducted multiple studies since 2023 that document the integration of analytics dashboards into remote education platforms, and these tools now provide real-time data on student engagement metrics across dispersed rural locations. Researchers at institutions including the University of Warsaw and Jagiellonian University examined data from over 12,000 students enrolled in distance learning programs between 2024 and 2026, with particular attention paid to regions such as Podlaskie and Lubelskie where broadband infrastructure remains uneven. The findings indicate that dashboards aggregate information from learning management systems, including login frequency, assignment completion rates, and quiz performance scores, allowing educators to identify patterns without requiring physical presence in each village schoolhouse.
Study Methodology and Data Sources
Teams collected anonymized platform logs from national education portals and cross-referenced them with teacher surveys conducted quarterly. One analysis published in the Journal of Educational Technology in 2025 tracked dashboard usage in 87 rural gminas, revealing that 68 percent of participating teachers accessed progress visualizations at least three times per week during the 2024-2025 academic year. Another project at Poznań University of Technology focused on technical implementation challenges, noting that dashboards pull from multiple data streams while maintaining compliance with Poland's data protection regulations. These efforts built upon earlier pilots funded through EU structural programs that concluded in late 2025, and new datasets are scheduled for release in September 2026 to measure longitudinal effects.
Key Findings on Progress Tracking
Evidence shows dashboards reduce the time required for teachers to compile progress reports from an average of four hours per month to under one hour, because automated charts display trends in participation and mastery of specific competencies. In rural settings where students often share devices or contend with intermittent connectivity, the systems flag periods of inactivity and send alerts that prompt follow-up calls or adjusted assignment deadlines. Studies found correlations between consistent dashboard monitoring and a 14 percent increase in assignment submission rates among secondary students in remote areas, although researchers caution that causation requires further controlled trials. Data from the Ministry of National Education's 2025 annual report, available through official channels, supports these observations by listing similar improvements in digital engagement statistics across eastern voivodeships.
Implementation in Rural Contexts
Observers note that rural classrooms frequently operate with limited on-site IT support, so dashboards designed with simplified interfaces have gained traction. Teachers in one Podkarpackie county program reported using color-coded alerts to prioritize outreach to families without reliable home internet, and the same tools helped allocate limited tutoring resources more efficiently. A separate investigation by Wrocław University researchers examined equity implications, finding that dashboards surface disparities in access to devices across households yet also enable targeted interventions such as lending programs coordinated through local libraries. These patterns emerged clearly in data gathered during the 2025 spring semester, when remote instruction expanded due to seasonal weather disruptions common in mountainous districts.

Broader Educational Outcomes
Academic performance indicators tracked through these platforms show modest gains in core subjects when teachers combine dashboard insights with personalized feedback loops. For instance, mathematics modules in one Mazowieckie rural network demonstrated higher average test scores among cohorts where instructors reviewed weekly activity summaries. European Commission education statistics from comparable member states provide context, indicating that similar dashboard deployments in Scandinavian rural schools yielded parallel engagement lifts. Polish studies emphasize that success depends on training programs, with over 2,400 educators completing certification courses by mid-2026 that cover interpretation of visualization tools without requiring advanced technical skills.
Future Developments and September 2026 Outlook
Upcoming releases of aggregated national data in September 2026 are expected to clarify how dashboards interact with emerging artificial intelligence features that predict dropout risks based on behavioral signals. Policymakers at teh central level have allocated additional resources for expanding dashboard compatibility with mobile applications, addressing connectivity constraints in the most isolated communities. Industry reports from organizations such as the European Schoolnet highlight ongoing pilots that test interoperability standards across different platforms, and Polish researchers continue to contribute findings to these collaborative efforts. The combination of university-led evaluations and government infrastructure investments continues to shape how progress data informs instructional decisions in rural remote settings.
Conclusion
Polish university studies collectively demonstrate that analytics dashboards supply structured visibility into student activity within remote rural classrooms, supporting more responsive teaching practices while surfacing infrastructure gaps that still require attention. Continued data collection through 2026 and beyond will determine the sustained impact on educational equity across Poland's diverse geographic regions.